PRTG
After how woefully lacking in detail for the novice in OS 10 switches the Dell documentation is below is a little snippet that can be used to configure your switches with what appears to be enough permission for PRTG (or a similar SNMP monitoring system) to keep an eye on them.
After entering configuration mode a readonly view with a base OID is set (I’d be grateful for some feedback on this!), then a group (prtg) is created to contain the user and defines readonly permissions, finally a user (prtguser) is created, assigned to the group (prtg) and the relevant password and privacy encryption strings set.
configure
snmp-server view readonly 1.3.6.1.2.1 included
snmp-server group prtg 3 priv read readonly
snmp-server user prtguser prtg 3 auth sha LONGANDSTRONGAUTH priv aes LoNGANDSTRONGPRIV
exit
write memory

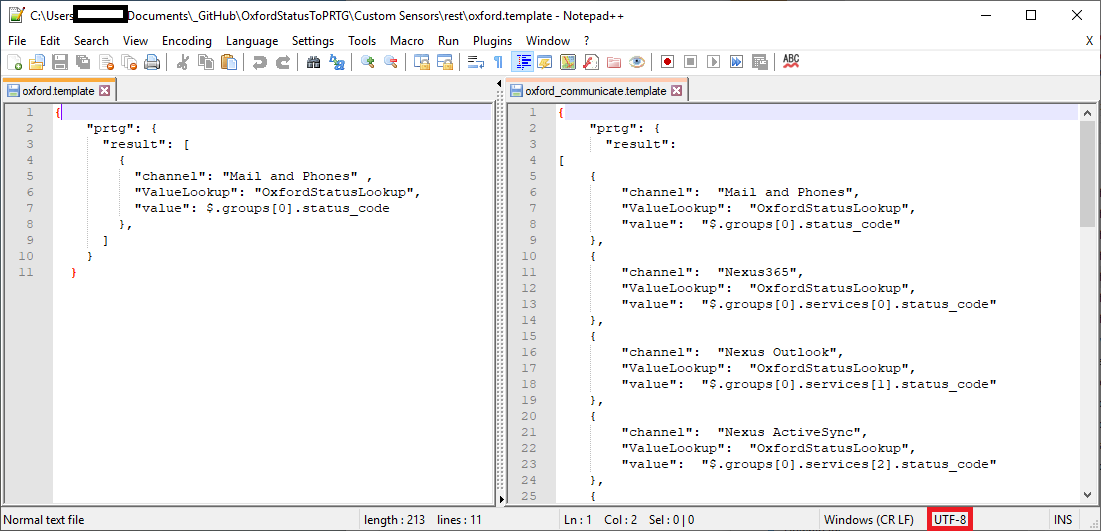
XML: The returned XML does not match the expected schema. (code: PE233) — JSON: The returned JSON does not match the expected structure (Invalid JSON.). (code: PE231)The cause is the default encoding from PowerShell is UCS-2 LE BOM as shown in Notepad++ below.


If you are looking to build out Zone Protection Profiles on your Palo Alto Networks Next Generation Firewall then it can be handy to know just what your connections per second metrics look over time for each zone. Quite lucky Palo Alto Networks have a little (although not entirely descript) guide on where you can get this data – https://docs.paloaltonetworks.com/pan-os/9-1/pan-os-admin/zone-protection-and-dos-protection/zone-defense/take-baseline-cps-measurements-for-setting-flood-thresholds/how-to-measure-cps.html.
With that information in hand it was just a matter of time before working out how to collect this data through PRTG so do follow on with the screenshot guide to find out how!
Handy strings:
1.3.6.1.4.1.25461.2.1.2.3.10
[rowidentifier] Connections Per Second
TCP
UDP
Other IP


The default graph options in PRTG (Setup > System Administration > User Interface) for extended periods of time (e.g. over 10 days) will display the average over a set period (e.g. 1 hour) – while this may be ideal for some data on occasion you may want to display the maximum or minimum value for the data over that period.
The example below shows just how much this can change the graphical representation of the data with the ‘max’ value when averaged as 48% while this climbs all the way to 53% when the graph purely displays the maximum values.

It’s the same data but the top graph shows a 1 hour average whereas the bottom graph shows the 1 hour maximum.
To change this display of data hop into the channel settings for the sensor and follow the screenshot guide below:


With thanks to the 50 staff from across the University for attending please see below the links to the videos and PowerPoints of the day!
Direct link to Playlist – https://www.youtube.com/watch?list=PLRxbdlgJzwyjAf820T0u4GpP0E01a9LEX&v=u-GVJ_0VuRM
Slides as PowerPoint
 1 Intro (4.3 MiB, 1,564 hits)
2 MDT (85.2 MiB, 1,944 hits)
3 PowerShell (27.5 MiB, 1,679 hits)
4 PRTG Network Monitor (47.5 MiB, 1,752 hits)
5 OpenVAS (32.9 MiB, 1,584 hits)
6 WSUS and Chocolatey (60.3 MiB, 1,797 hits)
7 NPS and VLANs (10.7 MiB, 2,668 hits)
Slides as PDF
 1 Intro (2.0 MiB, 1,688 hits)
2 MDT (2.2 MiB, 2,049 hits)
3 PowerShell (1.8 MiB, 2,159 hits)
4 PRTG Network Monitor (3.2 MiB, 1,609 hits)
5 OpenVAS (2.3 MiB, 1,749 hits)
6 WSUS and Chocolatey (2.9 MiB, 1,970 hits)
7 NPS and VLANs (1.4 MiB, 2,129 hits)
Stay tuned over the coming days for the scripts that are mentioned through the video which will be linked to from this post.

The screenshot above shows a portion of the sensor in its default form; in this post I’m going to show how to…
- Remove the red ‘downtime’ line from the bottom of the chart
- Set maximum and minimum values of the graph to display 0 to 100%
- Set the gauge to display its value in GByte instead of MByte
Red Downtime line
Pure aesthetics with this tweak – the memory sensor isn’t something that I would expect to ever encounter downtime (if there server were offline then the PING sensor would pause the memory sensor automatically). The only real application for the downtime sensor would be if WMI wasn’t responding.


Max and Min
PRTG will automatically set the scale for your graphs but I prefer to see the full range of 0 – 100%; this tweak makes that possible.


GByte instead of MByte
When working with servers with small amounts of RAM (lets say 4GB and less) it is typically going to work out best to view free RAM as MBytes but when working with Hyper-V hosts (48GB and 96GB in my case) GBytes are a much better value to work with.


The end result…

 Its been a day or so since buying a Microsoft Band 2 (took a while to find a high street shop that had one to try on in the first place!) and its proving rather useful to me as a person who rarely has his phone turned on loud and really never notices the little vibrations from it. My most recent application of Band 2 has been using it to receive push notifications from PRTG via my Windows Phone.
In all truth if you already have push notifications setup then you are probably already getting the notifications however if you are not keep reading to find out where to check for the right settings…
On the Microsoft Health App/Band Tiles


On the PRTG App


On your PRTG Console


On your Notification Settings


 Ever wanted to jump right into a SSH session from an item that you’ve seen in the PRTG Enterprise Console? By setting up a Device Tool its all too easy to do by just clicking on the device and pressing a function key on your keyboard.
Note that the Device Tool feature of the Enterprise Console can be used for a lot more than just setting up SSH sessions; for example I have modified the out of the box RDP connection to have a set height and width of the window or you could configure another new Device Tool to start a remote PowerShell session from a key press.
Either way here’s how to set it up for SSH…


Make no mistake I’m all for PRTG as my preferred Network Monitoring software so when I was asked to be featured in a case study I jumped at the chance.
That study is now live and can be seen here – http://www.paessler.com/company/casestudies/oxford_spires_uses_prtg

Another similar article can also be seen here – http://www.networkingplus.co.uk/case-study-details?itemid=351

Thin Clients are typically used to connect to VDI/Session hosted environments using though Microsoft/Citrix/VMWare technologies but they do have their other uses…
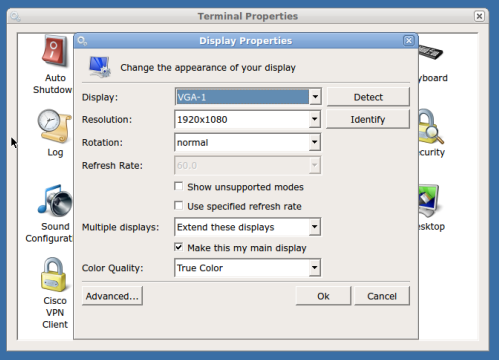
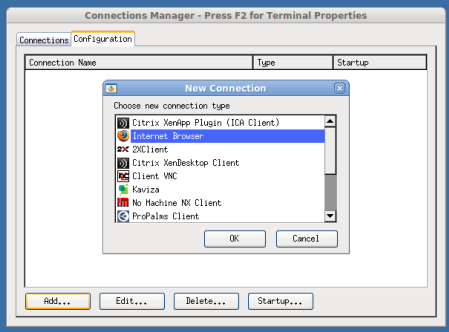
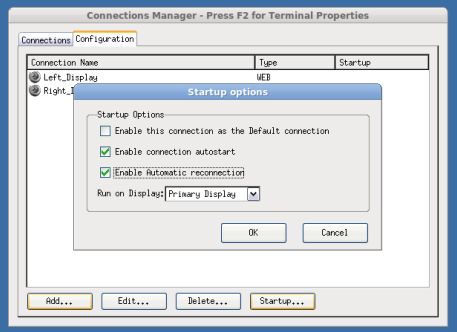
In this post I am going to show you how to setup a 10ZiG thin client (in my case the 5872v) running their custom made Linux PeakOS that will
- Display status maps from my PRTG network monitor server
- Run two displays
- Automatically display a different webpage on each display on boot up
- Automatically power off at 5pm (after the end of the day)


So all of that is great but why would I want to use a thin client instead of a full PC to power such a display?
- Upfront hardware cost is much cheaper and you get dual DVI as a standard (something you won’t find on most desktop PCs)
- The software required to use the thin client in this manner is built right in – no fiddling around with scheduled tasks/group policies
- Power consumption is lower – a thin client such as this one can draw little more than 12W when running such a display (a full desktop could be many times higher)
Want to go one step further? Higher end Windows powered thin clients like the 10ZiG 6818v and 6817v can be upgraded (at the factory) to run 4 displays off the same client, thus saving you from going with a power hungry graphics card in a full desktop PC.

Has this page helped you? Was it worth the cost of a Coffee? If so click here to donate £1.80 to the myworldofit.net coffee fund via PayPal.